
Visual Management of ISO 9001
Visual Management of ISO 9001 will help to achieve the best out your ISO 9001 Certification. In this blog, I wanted to explain by visually showing you one of the benefits of iso 9001. So what is iso 9001? ISO 9001 is a quality management system that will help you to structure your business in a way that you can consistently meet customer requirements.
That is a basic definition of what a quality management system does to your company. When you are going for an iso certification there are three main things that you have to focus on:
- first of all there are the key processes (these are the sales, purchasing, operations and design and development procedures)
- there is a documentative part – where we have to map out the risks and opportunities where we have to identify the requirements of interested parties
- information that we will need to keep as part of our implementation of iso 9001 but one of the most important elements within the management system is to have a supporting system
What is a supporting system?
A supporting system refers to the basic simple processes that a quality management system has to have to ensure that the company can consistently and reliably offer a good quality product or service to its customers. In this blog, I’m going to show you how by developing very simple systems for what these supporting systems. First of all, we can achieve the requirements of the standard of iso 9001 in a simple way and in a way that benefits the actual company.
Avoiding bureaucracy
A quick background about myself. In my first job, I was a quality engineer with a medical device manufacturer and I was impressed with the amount of bureaucracy that this company had. In my second job, my role was to work with a construction company to help them set up another company within their group of companies. And unfortunately, they had no systems or procedures in place on how work had to be done. In the meantime, I was looking for a master of science with the University of Malta on how I can help companies to improve their operational processes. That is where I’ve met iso 9001. This was way back in 2012. Since then, I’ve been helping companies to find the fine line between not having any procedures, and not even creating bureaucratic systems. So, in the point of this video, I want to show you in real life and in real practice how this is achieved when we are implementing iso 9001.
Collecting the data
And I would also like to take a quick detour and briefly explain where this data is coming from. This data is logged within a simple google sheet under the different columns and then the analysis is being done within google data studio. Nothing special is happening over here we are just submitting all the information in these google sheets. And then with a proper setup of google data studio, we can represent the data to help us to actually have a visual representation of our data. This allows us to be in a position to take a factual approach to decision-making.
Corrective Actions
As you can see over here this is data that is being collected on a google sheet. So in this instance, I am using google sheets and google data studio to represent the information in a way that can feed us data. And if we look at what we have on this screen right now for example here we can see that these are the corrective actions that were registered in 2020 and in 2021. And we can sort out this data by month for example by year.
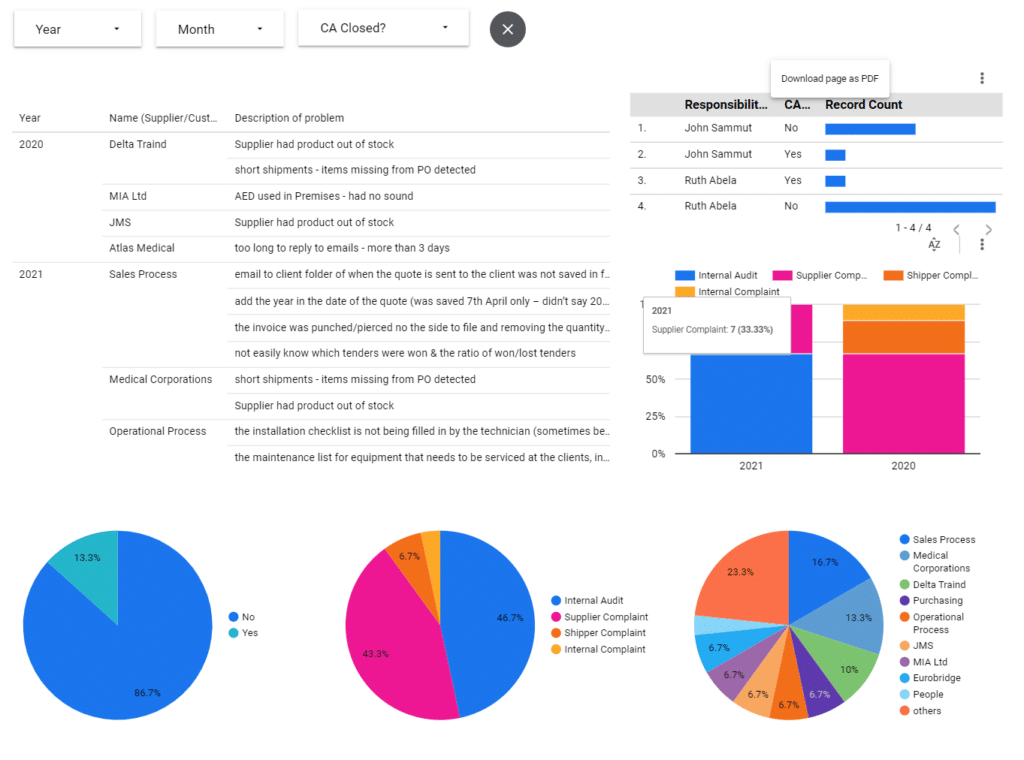
Perhaps what would be more beneficial at this stage is to know which corrective actions are still open. We can also evaluate the corrective actions that are still open and that therefore we have to do something about them. It also shows us and this is the benefit of managing data. In this case, has 17 corrective actions that are not closed and John Sammut has 9. When if we see the number of corrective actions that they, had it seems like they have both completed two corrective actions each. Naturally, this is very low but it goes to show that in this case. For example, Ruth has many corrective actions that she needs support on. On this chart for example we are seeing that most of the corrective actions were identified during internal audits. For 2021 but for 2020 we’ve had a higher number of supplier complaints and this can be seen that it actually increased.
So we’ve had seven complaints about here and six complaints here. And we can also see over here the number of corrective actions that were closed the source of all corrective actions.
The sales process seems to be the most problematic, then medical corporations, then there are particular clients and processes. And the point that I’m trying to convey with this screen is that corrective actions can be one of the most important elements in our business. Corrective actions can guide on which areas we should improve and by having a representation of the open corrective actions and the closed corrective actions. Who are the people that are involved in handling these corrective actions, the source of where all of these corrective actions are coming from and we can compare data from one year to the next? Then we can start to make decisions based on facts rather than opinions and in my opinion that is one of the key benefits of an iso 9001 certification.
Training records
So for example here we have training records and these are training that was actually completed by these individuals. And then we have a training plan for a number of hours on a particular topic that each person will be trained upon. Here we can see a visual representation of the topics on which training was completed. It shows that for example in this case study this organization is training its employees mostly on quality than on sales than on accounts than on MDR and finally product training. It might be or it might not be a good balance that this company is achieving.
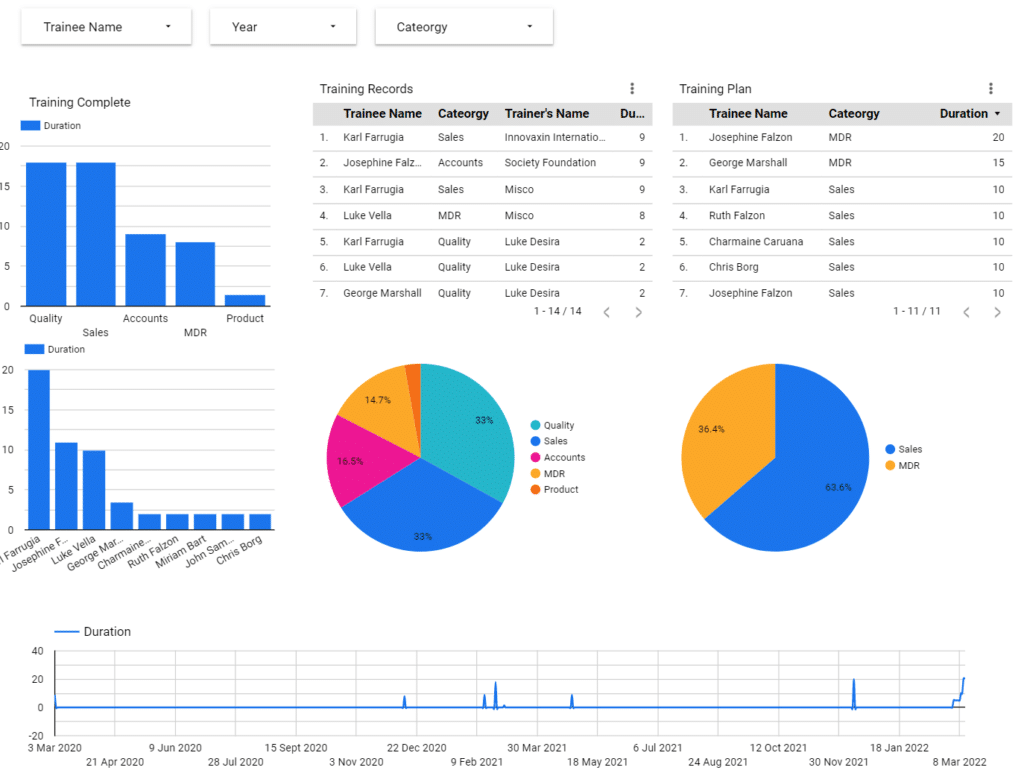
What I want to show you in this blog is that by collecting the information within the supporting system then, the management of the company can actually determine whether the topics of the training complete represent the actual needs of the company. And the same thing can be done for example in this case we are seeing that Karl Farrugia is being trained mostly in the company followed by Josephine Falzon and then by luke Vella. And then the other people are trained to a much less extent. Once again we can compare the data for the training records the training that was done and the training that is planned. Here we are seeing the number of hours dedicated to training on this on this timeline.
So far we have seen corrective actions and training records and training plans which are two of the requirements of the standard. And this is the type of data that we will need that you will need to be able to get certified and to run your quality management system.
Supplier evaluation with Visual Management of ISO 9001
What I would also like to speak about is the fact that supplier rating is also part of the supporting system. Here for example we are seeing in this first chart we are seeing the ratings of all the suppliers combined together from one year over the next. And it was good to see that the overall average is increasing year over year for such suppliers. In fact, we can see a huge spike for example in the performance of complex complaint handling by our suppliers. Moreover here we are taking data from the corrective actions that have specifically to do with particular suppliers. We are comparing that data to the evaluation of suppliers so when we come to the evaluation of suppliers we have already some factual data that can help us to make informed decisions.
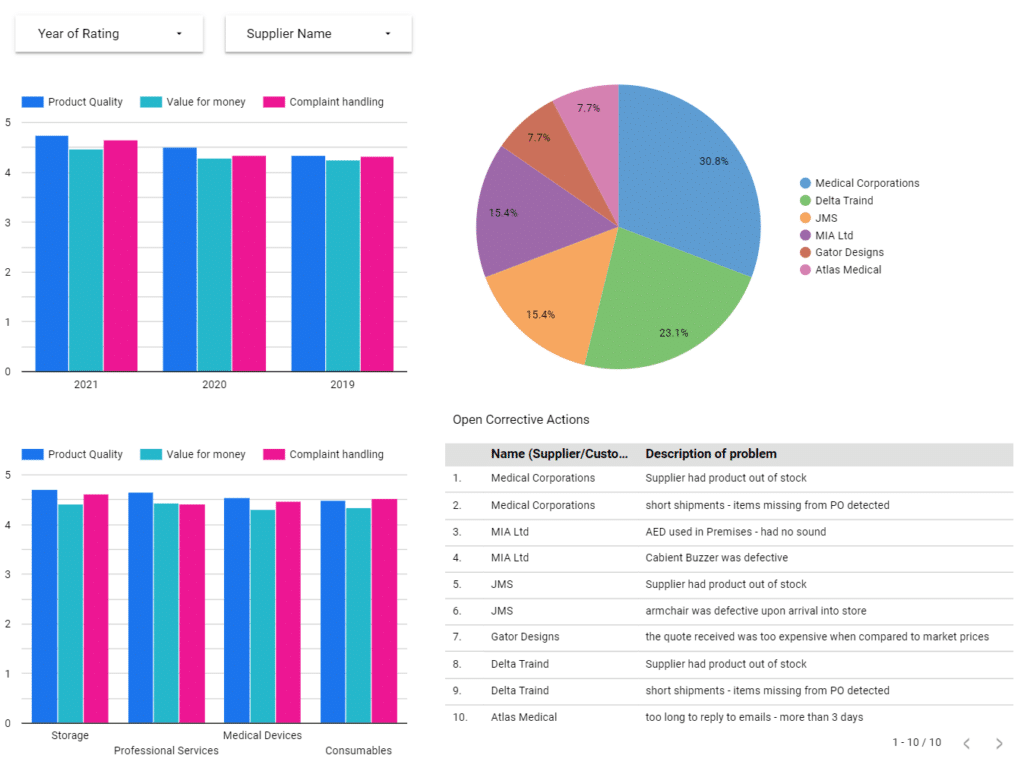
Moving on then we can compare for example different elements relating to criteria that we are evaluating our suppliers on. From one year to the next as well for example when it comes to consumables. When it comes to medical devices and when it comes to storage we are evaluating the different suppliers on the different topics naturally this data can be changed and streamed as per the benefits of the company that I am working with. What I’m trying to convey in this message is that by having this type of visual representation of the data that we are collecting in our day-to-day running, we can make much more informed decisions.
Quality Objectives with Visual Management of ISO 9001
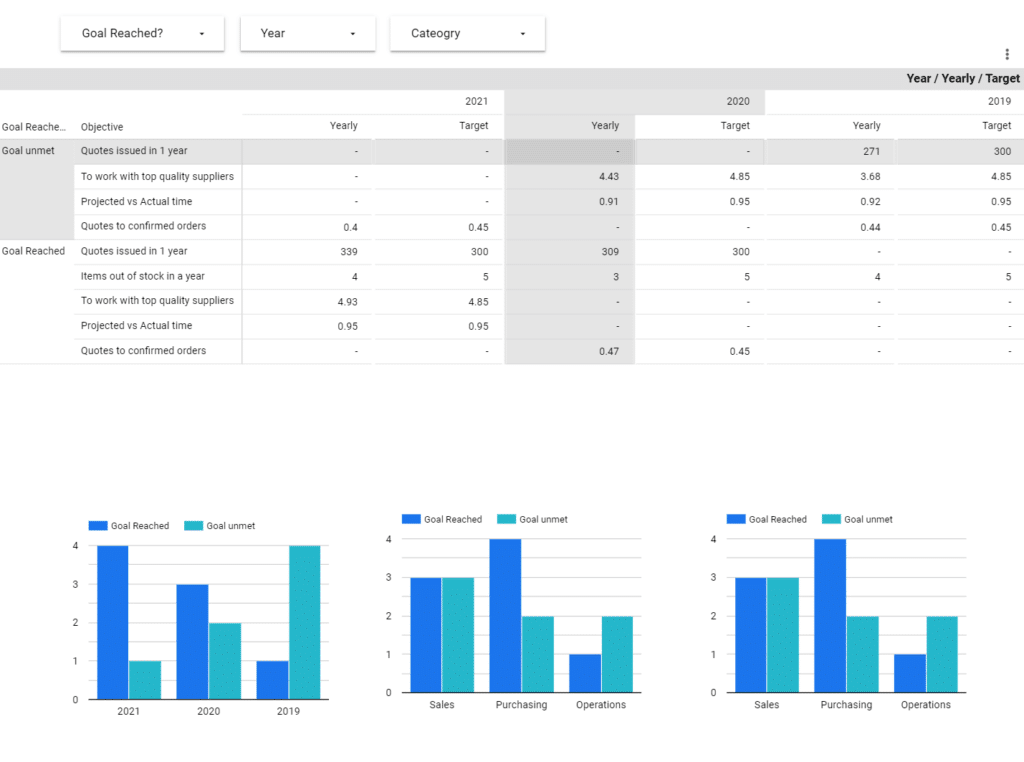
In this visual representation of examples of quality objectives for ISO 9001 for a manufacturing company, I have split the objectives by whether the goal has been met or whether the goal has not been met. I am also plotting the data for example the sales; we are reaching we have reached all of our goals for sales. We have not reached all the goals when it comes to purchasing and there is a lot of work that still needs to be done when it comes to operations. For the goals relating to this company. Again the idea of an iso certification isn’t to have a perfect management system but to have a management system that inherently gives us the data that we need to make informed decisions with the idea and mindset of continuous improvement. So that is where we are aiming to arrive as a company.
Organisational knowledge
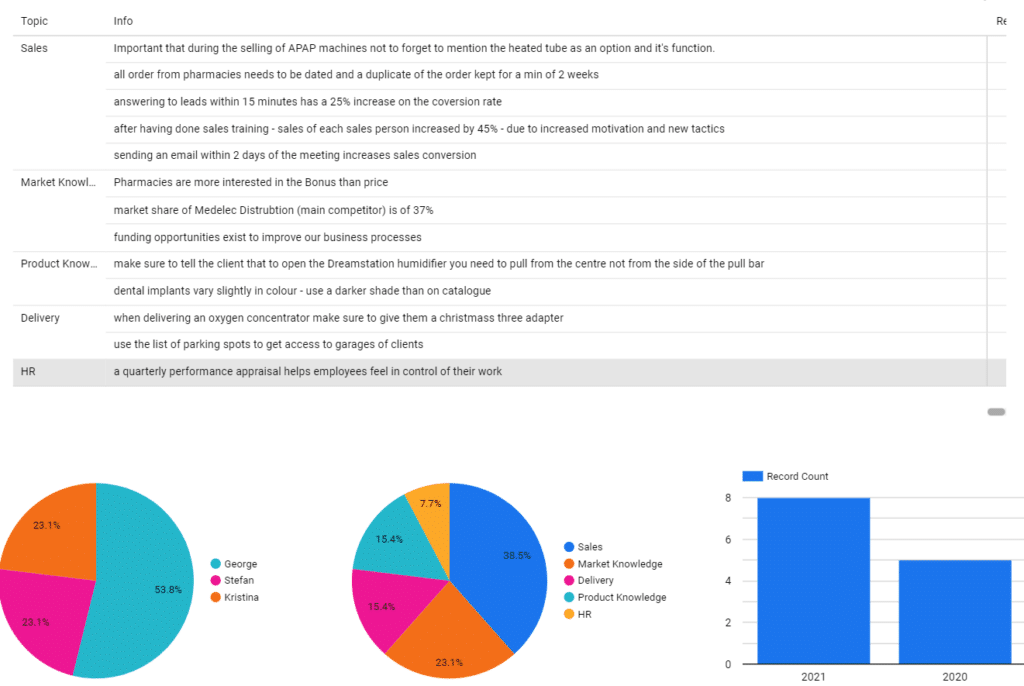
The next chart that I would like to discuss briefly is organizational knowledge. Here we have George which seems to be acquiring much more knowledge than Stefan and Kristina are. From this chart below it seems that are as an organization we are getting most of our knowledge when it comes to sales and then market knowledge and then delivery.
The chart also shows that in 2021 we’ve had more lessons learned than in 2020. And over here we have a repertoire of all the lessons that we are learning as an organization. And perhaps you know this organization and knowledge is one of the requirements of the standard and by using this simple supporting system we are certainly meeting that requirement by capturing the knowledge of the different individuals within our company to help us improve on the operational performance of the business. next up
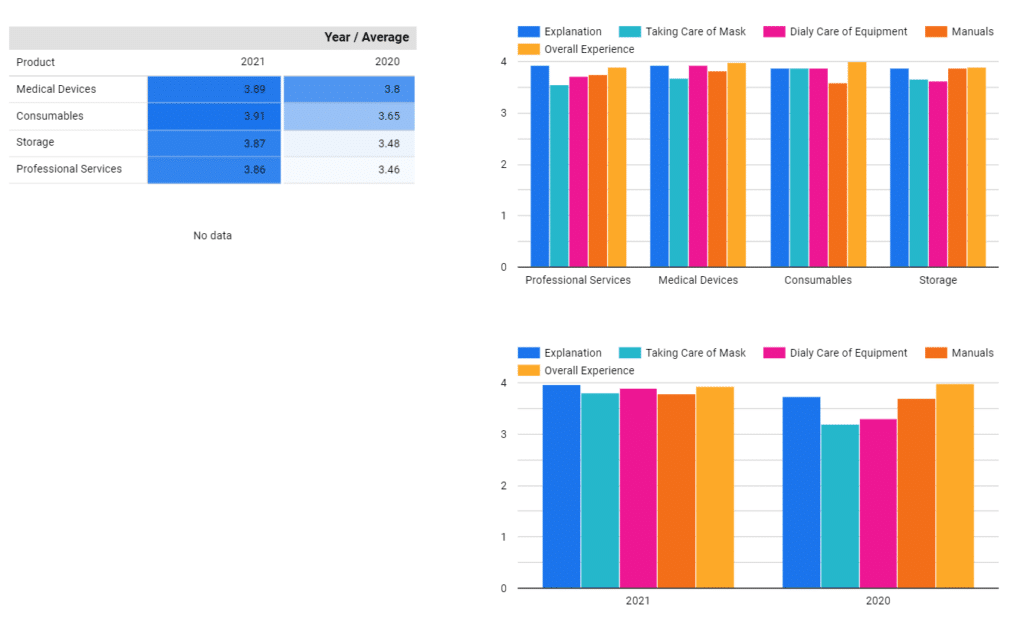
Customer feedback with Visual Management of ISO 9001
Here, as part of our Visual Management of ISO 9001, we are evaluating for example our performance from 2020 to 2021 and we are splitting the ratings by the product itself. So these are simple representations that we can consider when we are creating our supporting system.
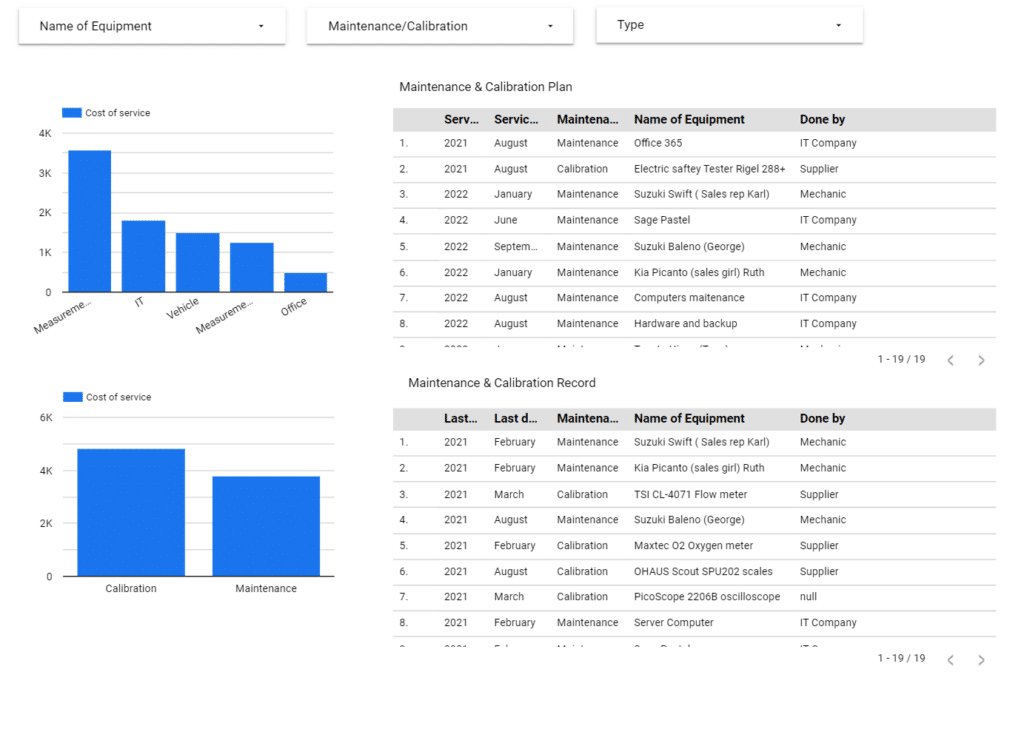
Equipment maintenance and calibration
Here we can see simple equipment maintenance and calibration plan and record. So in the plan, this is the plan whereby we are stating what type of maintenance or calibration still needs to be done. And it is also showing maintenance and calibration that has already been done.
Conclusion on Visual Management of ISO 9001
In this blog about Visual Management of ISO 9001, I wanted to go through the requirements of the standard of iso 9001 when it comes to the supporting system. Another requirement of ISO 9001:2015 is to run Management Review Meetinngs with samples. Visual Management will inherently help to foster conversations and decisions based on data, rather than on opinions.
You can find thousands of templates online that you can use to meet the requirements for the supporting system, however in my experience it is much more simple to stick the data that I’ve shared in this video to meet those requirements. Moreover, for other topics like internal & external issues for ISO 9001, following simple templates that will help you to take informed decisions works too, for you to ensure that you meet all the requirements within the clauses of ISO 9001:2015.
Secondly, I also wanted to do this video to help you to understand and truly appreciate the benefit that ISO 9001 can bring to your organization if and only if you are collecting your data in a way that makes it easier to analyze and understand in a way that enables you to take facts based on decisions rather than on opinions.
That is all I had for you for the blog. I hope that you have found it informative and that it will help you to further improve on the implementation and or auditing of iso 9001. If you have any questions please feel free to get in touch I would love to help.